
In Charts: Disappointing Summer Movie Sales
Students can analyze charts and create their own to illustrate that moviegoers are venturing out less and less for the summer theater experience.

The first chart, created by the New York Times, is attractive and, focusing on just the top five movies each summer, gives us an idea of movie results. Here are a few issues students might find:
Movies six through ten could have had good results that significantly change the comparisons. For example, in the bar and line charts, below, we see that total 2023 box office sales were higher than 2024, which doesn’t show here. But if the goal is to focus on only a few movies, then, at a glance, we can see the winners and their contribution to the group.
Years 2020 and 2021 are missing, which makes sense because theaters were closed for much of that time. But omitting them entirely from the X axis may be misleading.
The chart includes a subtle organizing principle: the biggest hits are at the bottom. But the progression is difficult to see because several others are close in sales. Wider white dividing lines might better distinguish each movie.

The second chart from the NYT represents total box office sales dating back to 1980 with all years included. The bars provide a specificity that ChatGPT’s 2010-2025 line chart, below, doesn’t. (ChatGPT’s first version didn’t adjust for inflation, so the numbers didn’t quite match.) With the line chart, we see the downward trend since around 2015 more clearly. With the bar chart, we see more dramatic changes, for example, drops between 2013 and 2014 and between 2016 and 2017. These moves either don’t show on the line chart as clearly or, quite possibly, ChatGPT has a data issue. Without data labels on both these charts, nuance is difficult to see.
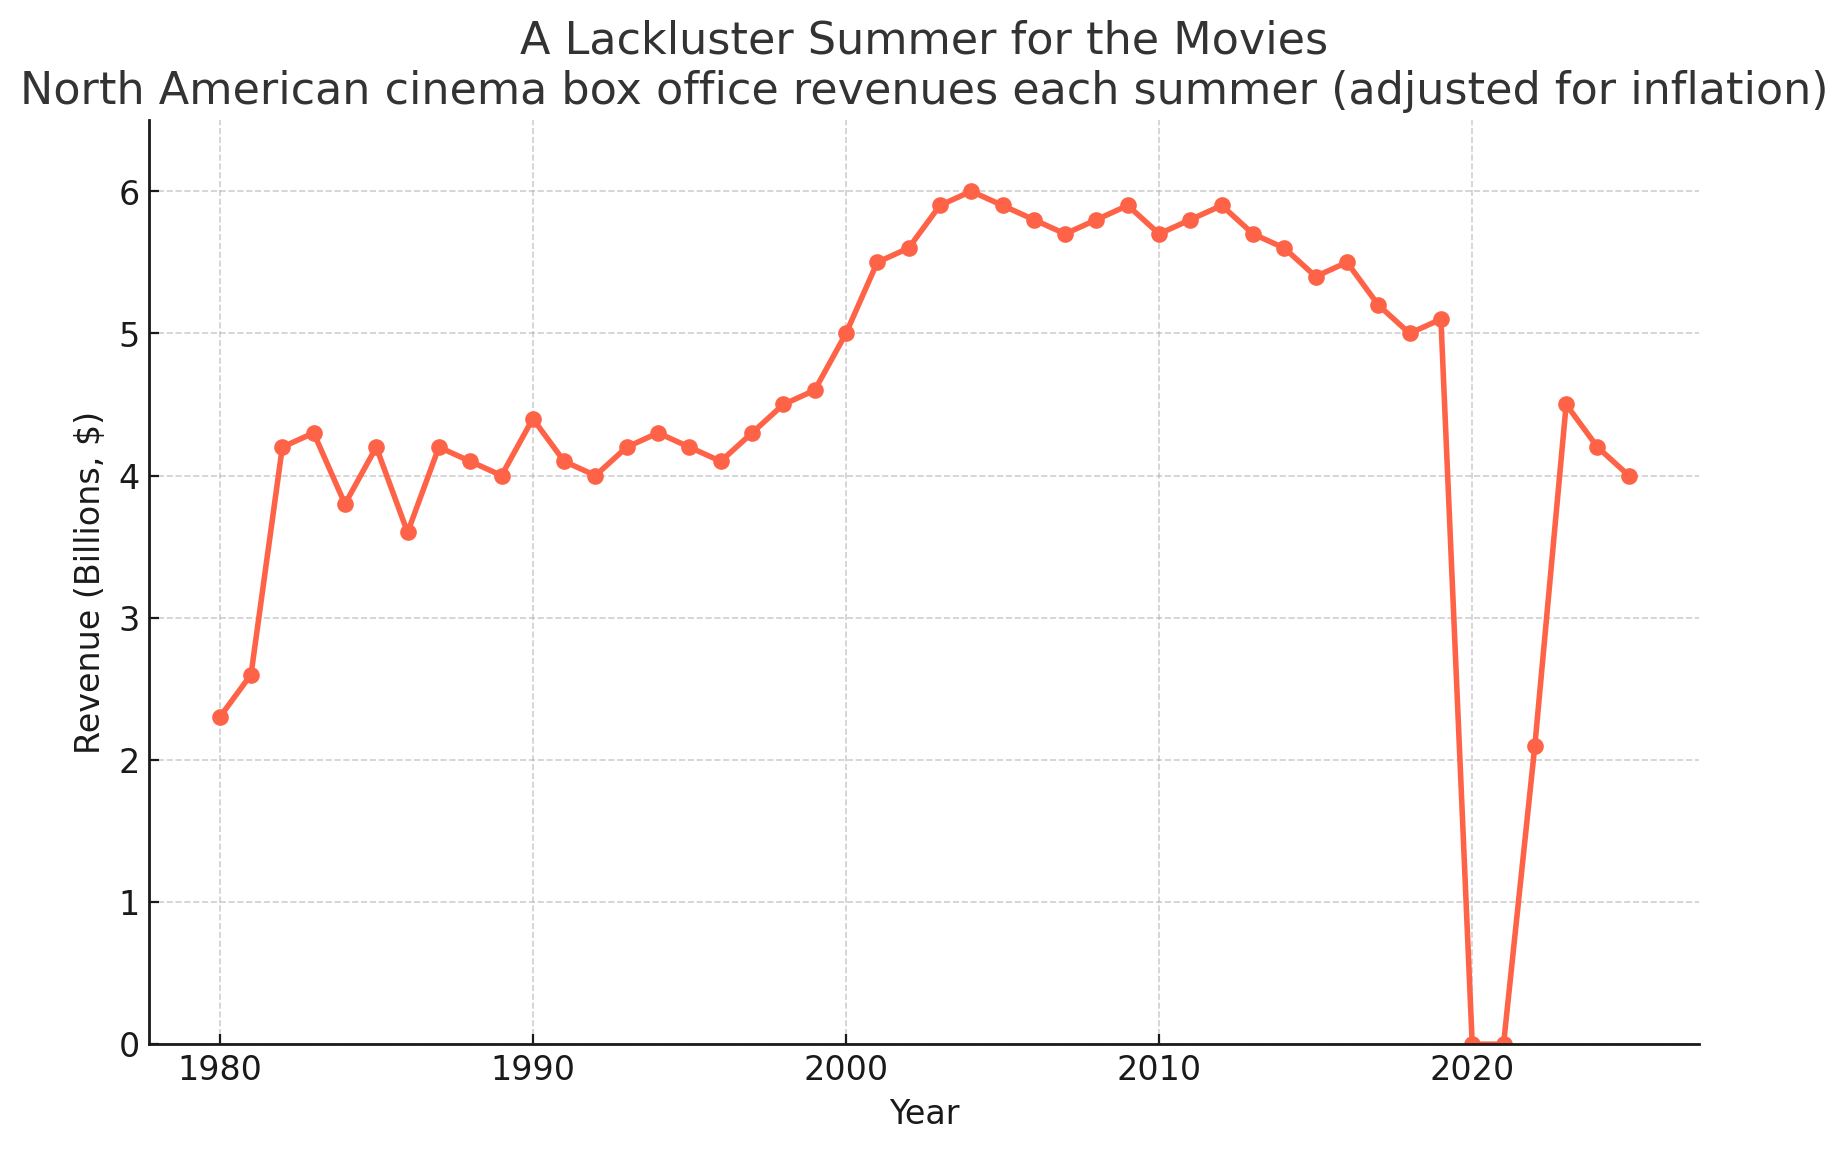
Comparing the bar and line charts illustrates the importance of choosing a graphic for the purpose and audience: a focus on results from each year or a trend over time. Either way, the news isn’t good for an industry trying to make a comeback.
Students might create their own charts. They might have fun comparing box office sales for their favorite summer movies or showing where theaters get their revenue. Superman cost me $12 for two matinee movie tickets and an embarrassing $24 in snacks. Despite high-margin extras like popcorn and soda, audiences who visit a few times a year won’t sustain a local theater. Clearly, Nicole Kidman’s AMC ad, spoofed by SNL, didn’t convince us to leave our houses for “the indescribable feeling we get when the lights begin to dim.”