
Treemap Shows S&P Index
The New York Times uses a treemap to show how the stock market is dominated by two companies. The article, titled, “How Big Tech Camouflaged Wall Street’s Crisis,” warns that concerns about the market aren’t always as they appear.
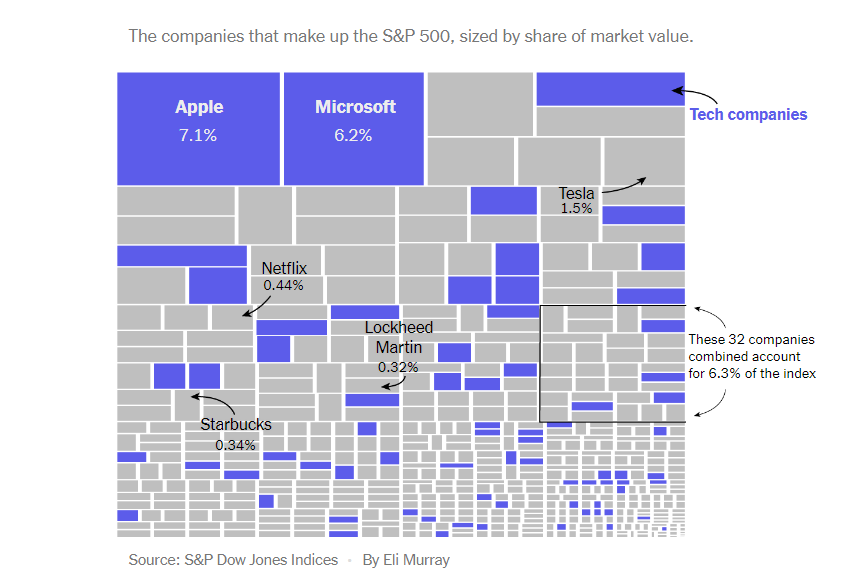
The article encourages us to temper reports about financial conditions based only on the S&P 500. The first paragraph of the article says it well: “The fate of the S&P 500 index—used by investors as a barometer for the health of corporate America, and cited by presidents as a measure of their handling of the economy—often comes down to just two companies: Apple and Microsoft.”
The treemap is a good choice to display large amounts of data, with each box or rectangular sized proportionately. In this case, the results are dramatic. We see how Apple and Microsoft stocks can sway the entire index. With text callouts, authors identify well-known companies and a group of 32 for comparison.
Students will find a treemap among standard Excel charts. This one is a good example of how they can be used—with additional comments.